Program Terminology
- The term R refers to both the programming language and the software that interprets the scripts written using it.
- An IDE is an “Integrated Development Environment” and essentially is another program that lets you interact with R in a productive and efficient manner.
- RStudio has been a very popular IDE since around 2011 that has continued to flourish and improve throughout the years.
- Positron is a new IDE created by the developers of RStudio that is based off another popular IDE called VSCode - and aimed primarily at Data Scientists
This book teaches you how to use R from within the R Studio IDE as we feel it is easier for new learners to start with. You will have to install both onto your computer. Setup instructions are discussed later in Section 1.1 Installing R and R Studio.
Motivation
Why use R?
- Open source, cross-platform, and free
- Great for reproducibility
- Tons of learning resources
- Works on data of all shapes and sizes
- Produces high-quality graphics
- Large and welcoming community
- Flexible and extensible. Doesn’t do something you want? Create a custom function for yourself.
- Currently R is used in many upper division & graduate level Statistics and Research methods courses in domains such as Public Health, Economics, Finance, and Political Science.
Why use R Studio?
- Customizable workspace that docks all windows together.
- Notebook formats that allow for easy sharing of code and output, and integration with other languages (Python, C++, SQL, Stan)
- Syntax highlighting, warning errors when missing a closing parentheses.
- Cross-platform interface. Also works on Windows/iOS/Linux.
- Tab completion for functions. Forget the syntax or a variable name? Popup helpers are available.
- One button publishing of reproducible documents such as reports, dashboards, presentations, websites like this one!
Programming can be scary!
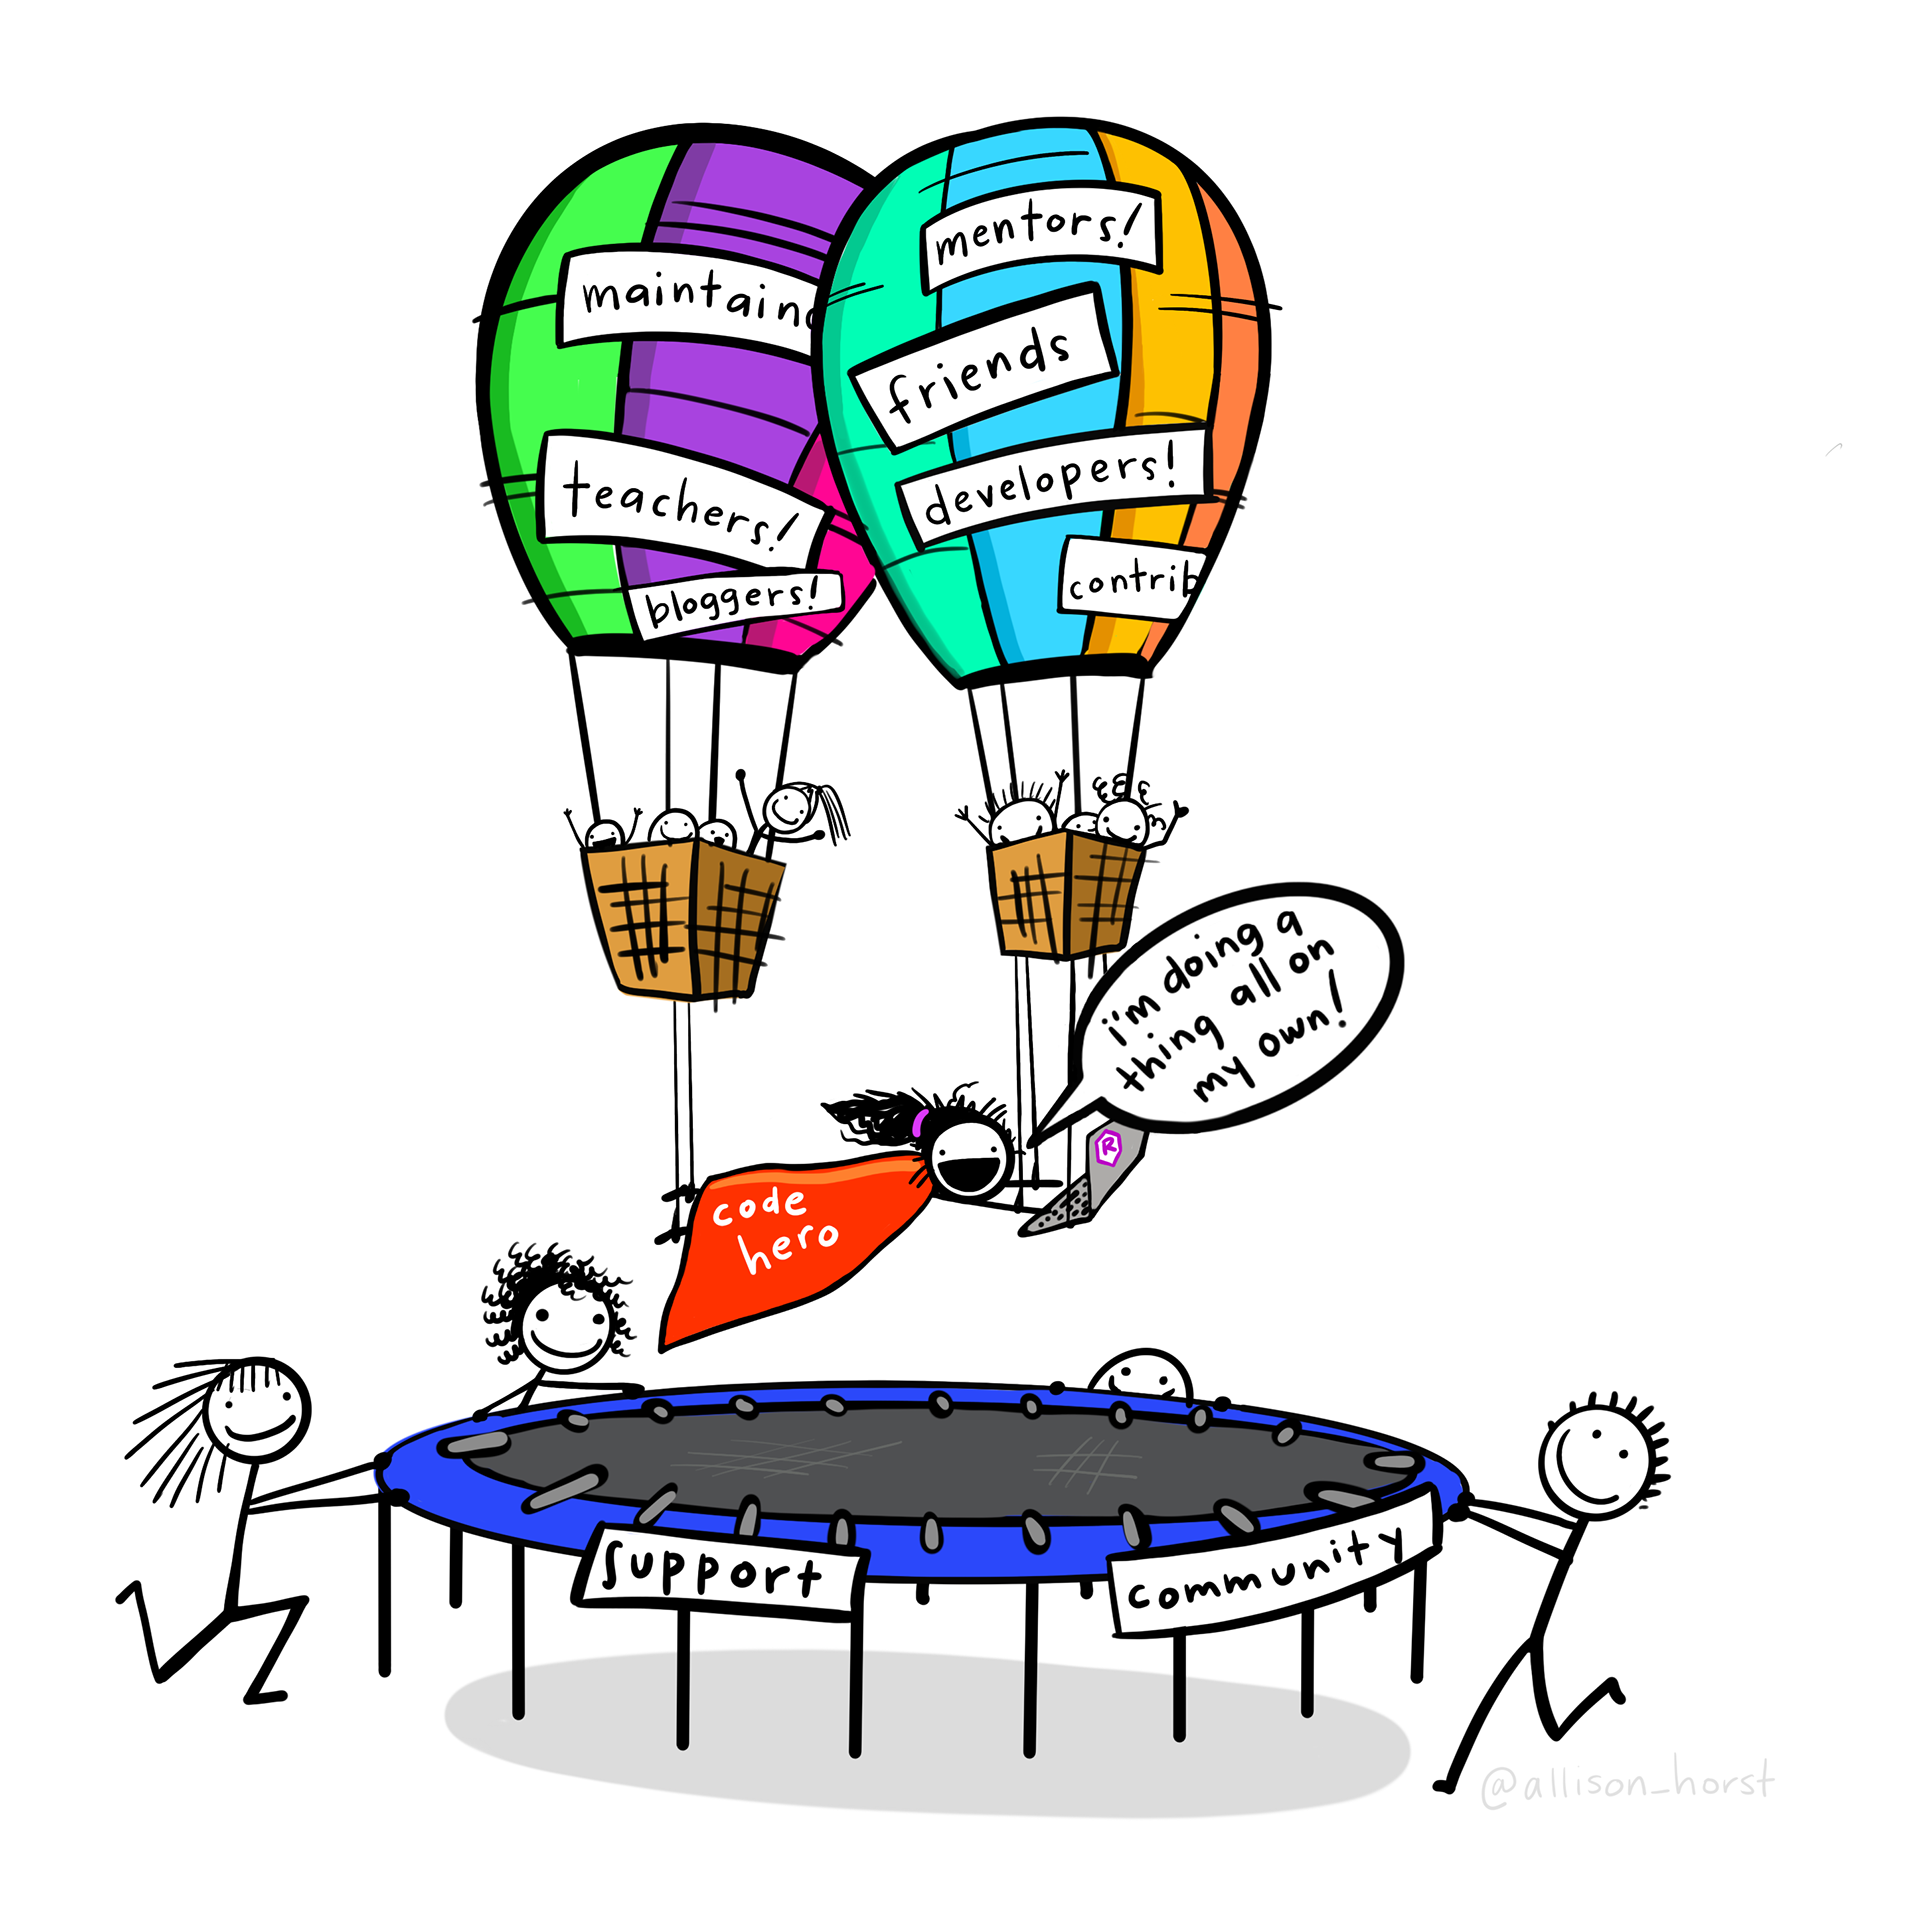
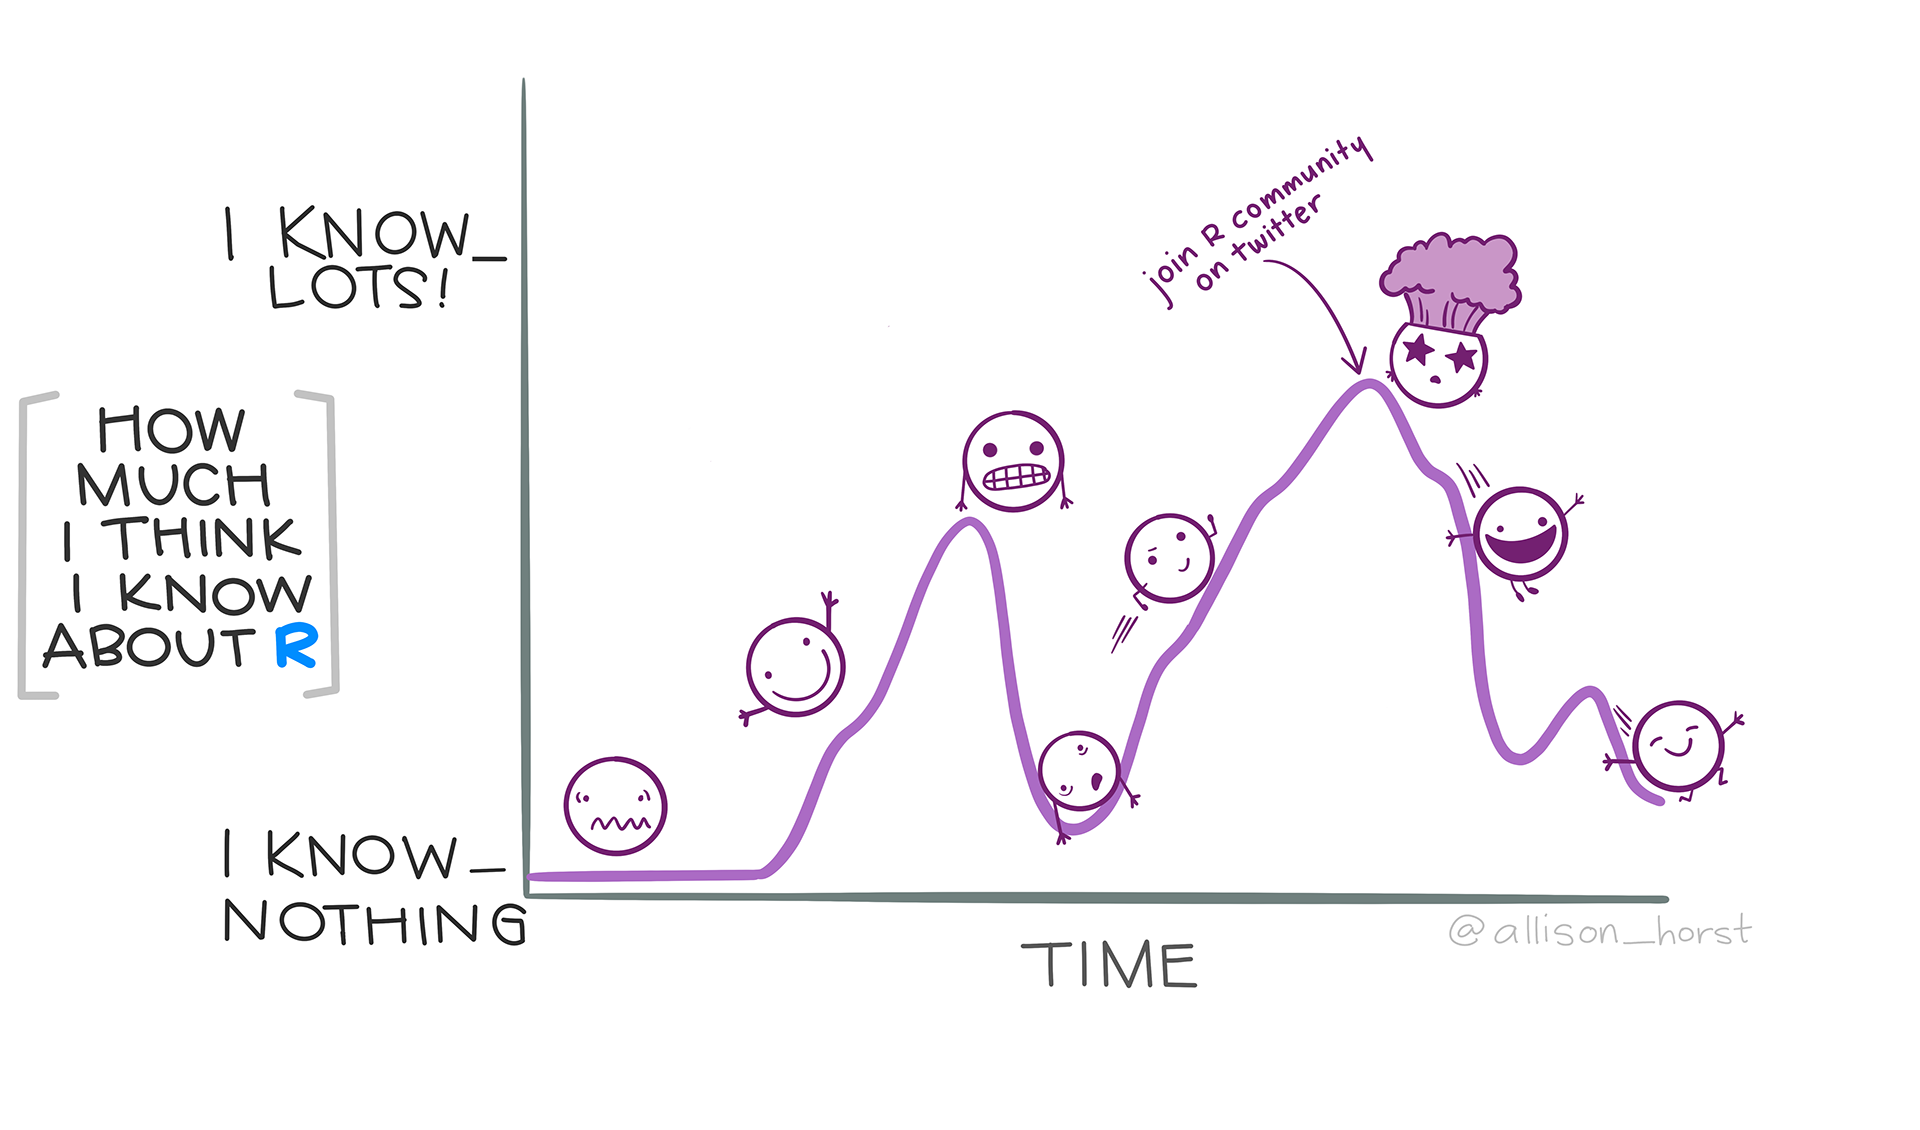
It’s important to acknowledge that computer programming is a new skill, that may bring a roller coaster of emotions with it while you learn.
But you don’t have to go at it alone! You are now part of a learning community that you can lean on for questions and support.
Learning to program has lots of benefits
- Improves your logical skills and critical problem solving
- Increases your attention to detail
- Increases your self reliance and empowers you to control your own research.
- Your PI will love your awesome graphics and reports.
- Some people think what you do is magic.
- Thinking graduate school? expect to learn this on your own
- A few other lists of reasons
Why no point and click?
Because it’s not reproducible.
- Which boxes did you click last time?
- New data? Gotta do it all over.
- Need to expand your model? Gotta do it all over.
- Made a mistake in the data coding? Gotta do it all over…
How this book is organized
Callout blocks
Black boxes contain notes and information for you to be aware of (Blue in dark mode).
Green boxes contain “you try it” examples for you to try on your computer.
Red boxes contain warnings such as common errors or pitfalls.
Yellow boxes contain links to supporting videos.
Sometimes there are side notes presented in the right margin
Over Here!
🚧 Section under construction
Code and keystroke appearance
In these notes, code that is referenced in text is displayed in this format, code is executed (run) by R is displayed like this:
where the output or result of the code is displayed directly after. The [1] that is sometimes displayed with the output helps count the lines of output (sometimes), and can be ignored most of the time.
When giving instructions on which keys to press, buttons are shown as boxes like CTRL or ENTER .
Getting and Submitting Assignments
All assignment files can be found in ?sec-assignments . Submission instructions vary by instructor so check your syllabus for details.